What Sales Attrition Really Costs: The Hidden Revenue Gaps No CSO Is Tracking

Why recruitment spending is the visible tip of an iceberg, and what the data shows for inside vs. field sales
This analysis is the sales-specific extension of our post What Turnover Really Costs (March 2026), focusing on the distinct cost dynamics of inside sales versus field sales.
Organisations count recruiting costs and call it sales turnover management. In doing so, they systematically ignore the part that is three to six times larger: the revenue loss from disrupted pipelines, lost customer relationships and the ramp-up effect, which frequently begins before the departing sales rep has even given notice. Turnover is not an HR problem. It is a strategic revenue and margin risk that the majority of sales organisations measure incorrectly and therefore consistently underestimate.
Executive Summary
Hidden sales turnover costs exceed direct recruitment and onboarding expenses by a factor of three to six, with productivity and revenue loss during ramp-up and pre-departure as the dominant driver at 65 to 85% of total costs.
Up to 55 to 70% of revenue losses occur before a sales employee has even left the organisation, a mechanism that no standard turnover reporting captures.
Total departure costs amount to 150 to 300% of annual OTE; for complex field sales roles, they routinely exceed 250%, with a strongly non-linear increase as relationship depth and territory complexity rise.
1. The Measurement Problem: Why Sales Organisations Systematically Underestimate
What is not measured is not managed. Sales turnover is, in most organisations, a precisely tracked recruiting process and a systematically unmeasured revenue gap.
Current industry analyses from 2022 to 2026 (SPOTIO State of Field Sales 2026; Everstage Sales Productivity Statistics 2025; MarketBetter.ai SDR Turnover Analysis 2026) reveal a consistent pattern: organisations measuring only direct costs report turnover figures that are one-third to one-fifth of those reported by organisations that comprehensively include indirect costs. For SDR teams (inside sales), replacement is initially calculated at €15,000 to €25,000, when ramp-up losses and pipeline gaps are fully included, the figure rises to €115,000 to €195,000 per departure, a fivefold to eightfold increase (MarketBetter.ai, 2026).
The measurement problem is structural: recruitment expenditures are bookkeeping-legible. Revenue loss during onboarding, declining pipeline quality after resignation announcements, and the relationship-rebuilding burden on remaining sales staff appear in no cost centre report. They occur nonetheless, and dominate the actual cost structure, particularly in field sales, where a single lost key account contract immediately exceeds all direct costs combined.
👉 Key Insight: The sales turnover problem is primarily a measurement problem. Organisations reporting only recruitment costs are examining 20 to 35% of actual costs, and making retention decisions on a data foundation that systematically points in the wrong direction.
Figure 1: Cost structure of a sales departure, visible vs. hidden cost shares (inside sales vs. field sales)
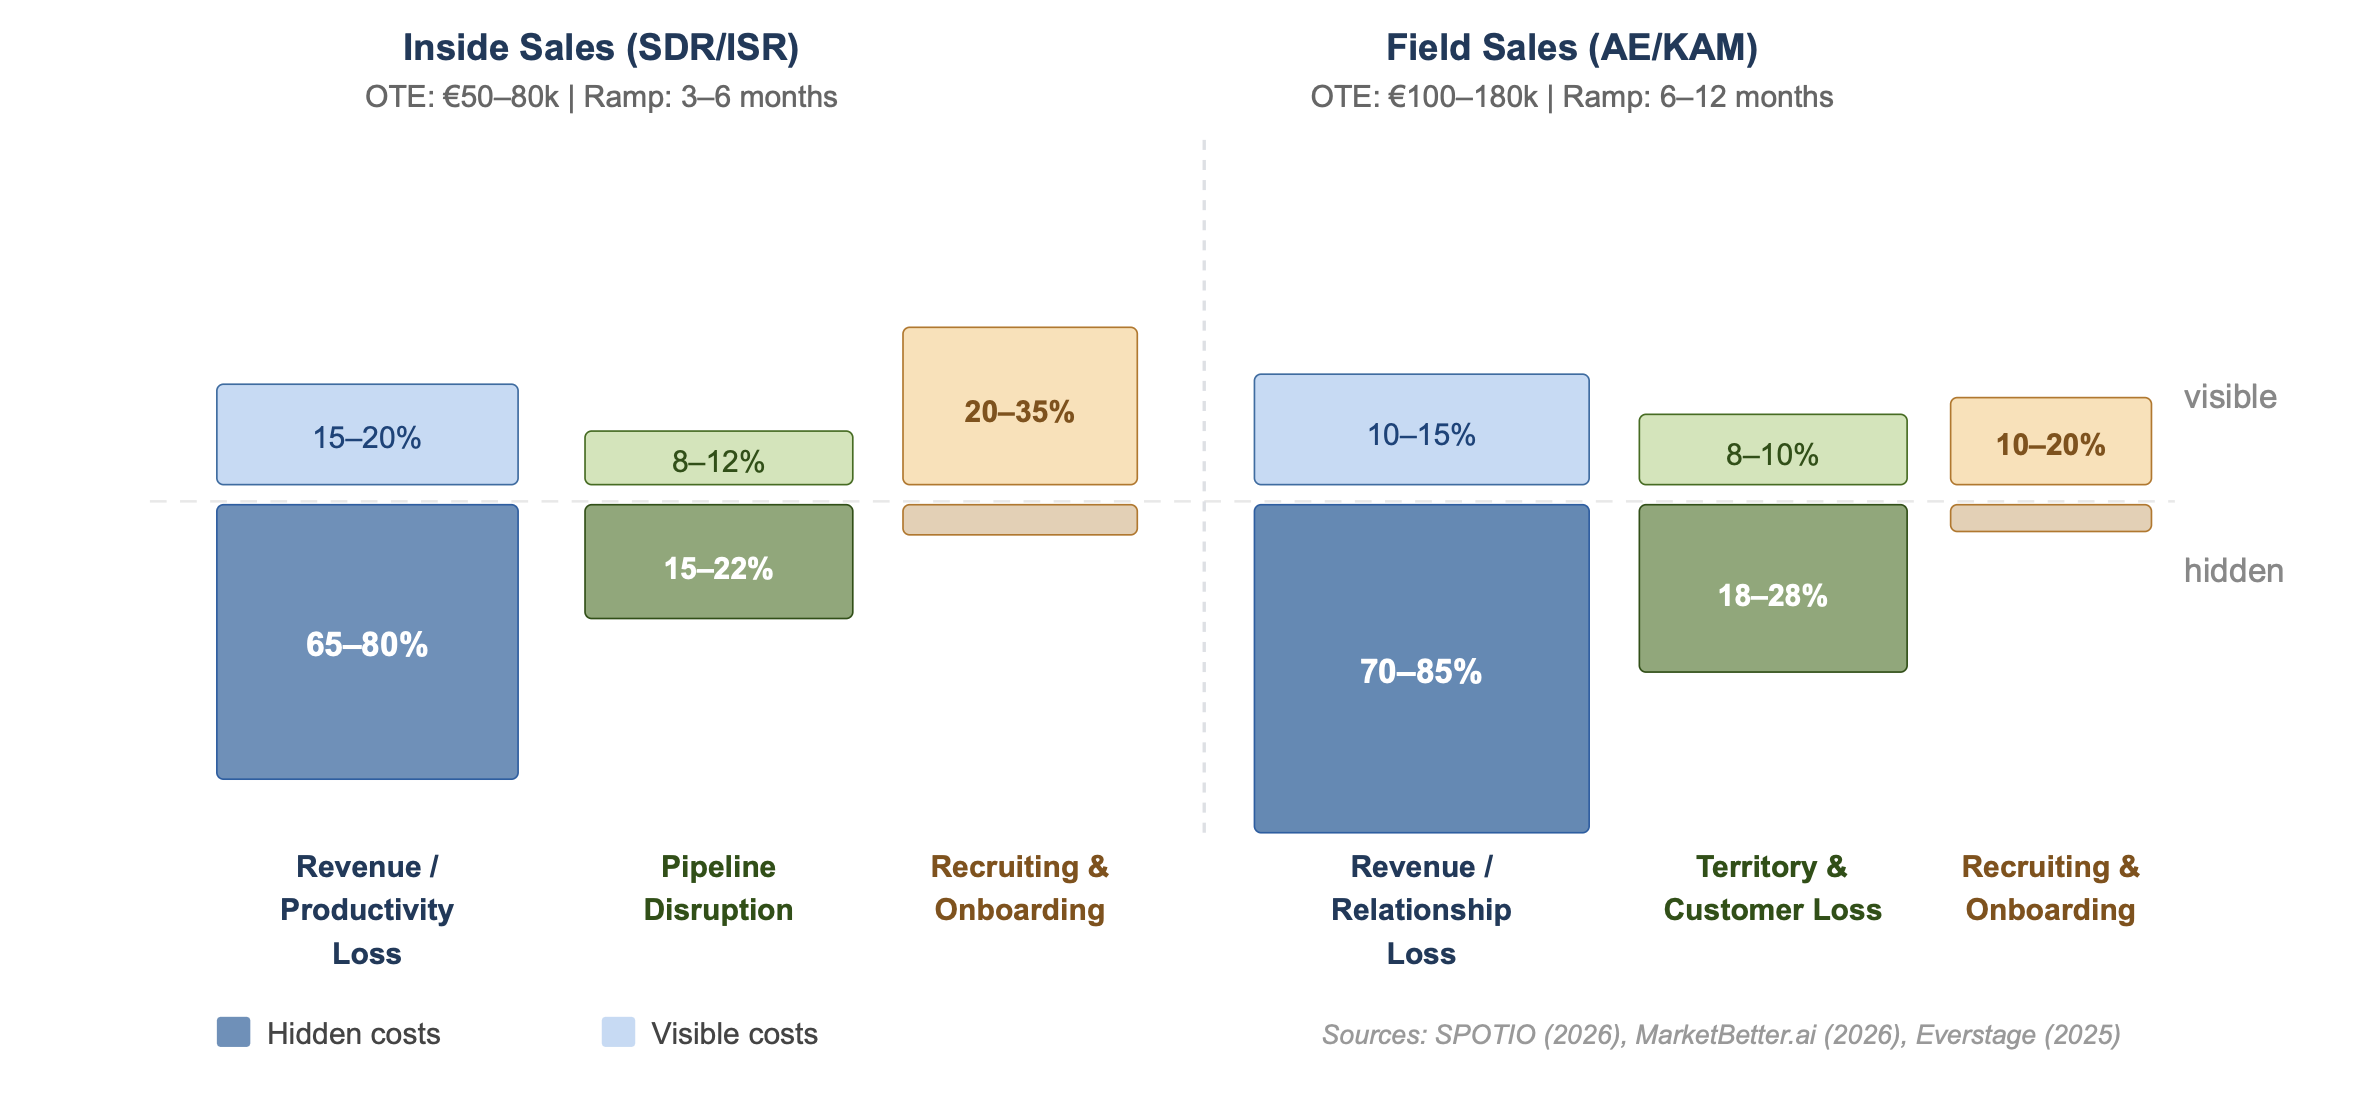
2. Productivity and Revenue Loss: The Invisible Primary Driver
65 to 85 percent of total sales turnover costs arise from productivity and revenue loss. Not from job postings, not from interviews, from the ramp-up effect of new sales reps, and from an effect most CSOs are not tracking at all: the pre-departure revenue loss.
Current SDR analyses show that 70 to 80% of post-departure costs are attributable to reduced productivity and lost opportunities during the 3- to 6-month ramp-up phase (MarketBetter.ai, 2026). For complex field sales roles, industry data quantifies a revenue loss of €250,000 to €500,000 per rep from disrupted territory pipelines and absent customer relationships, from a single region (SPOTIO, 2026). Reducing turnover could lower variable sales costs by 4 to 7%, representing significant gains in both revenue and margin.
The pre-departure effect is particularly pronounced in sales organisations: once a resignation is internally known, pipeline activity from the departing rep drops measurably. Remaining colleagues begin allocating time to handover preparation rather than closing and prospecting. In inside sales teams with high call volumes, the effect manifests rapidly; in field sales, the consequences are more durable and harder to quantify because face-to-face customer relationships cannot be transferred on a spreadsheet.
👉 Key Insight: Revenue loss begins with the departure decision, not with the final working day. Sales organisations that treat turnover as a cost problem only at the exit point have already caused the majority of the revenue gap without ever measuring it.
3. Role Complexity: Inside vs. Field Sales, Why Costs Escalate Non-Linearly
An SDR departure costs different orders of magnitude from the departure of an experienced key account manager. That is intuitively clear. The actual range is still surprising: factor three to five within the same organisation, between volume-driven inside sales and relationship-driven field sales.
Current field sales data shows: replacing a typical field sales rep costs €150,000 to €300,000 (including ramp-up loss), while SDR positions in inside sales run €115,000 to €195,000, at a substantially higher turnover rate (SPOTIO, 2026; MarketBetter.ai, 2026). The difference is explained by three factors: longer recruitment and ramp-up timelines in field sales (6 to 12 months versus 3 to 6), deeper onboarding curves driven by specific territory and customer knowledge, and higher opportunity costs from lost key accounts that cannot simply be reassigned.
In knowledge-intensive B2B environments, the rule is clear: the more complex the product and the longer the sales cycle, the steeper the non-linear cost escalation. For SDR teams, volume loss dominates (fewer calls, fewer leads); for field reps, relationship loss drives the damage, with direct impact on repeat business, cross-selling and net revenue retention.
👉 Key Insight: Retention investments must be role-sensitive in their calculus. A 15 to 20% OTE increase or incentive adjustment for a field sales position whose turnover costs 200 to 300% of OTE is not a cost problem, it is a protective investment with a positive ROI.
4. Pipeline Disruption and Customer Loss: The Ripple Effect in Sales
Turnover does not only affect the rep who leaves. It affects the entire sales ecosystem, pipeline, CRM, team dynamics and customer relationships, generating downstream costs that propagate through revenue planning over quarters.
Field sales reports show that an outside sales transition regularly leads to a 10 to 20% decline in close rate, as specific customer knowledge is lost and new reps must rebuild trust from scratch (SPOTIO, 2026). For inside sales teams with high turnover rates (up to 50%+ in some SDR organisations), additional costs arise from continuous lead re-qualification and lost pipeline momentum. The consequence: each significant departure can drive 5 to 15% higher sales costs per quarter, visible only months after the exit, when pipeline gaps hit forecast numbers.
The ripple effect is particularly destructive in small teams: remaining reps absorb pipeline handovers, lose co-selling partners and temporarily manage heavier workloads, which in turn drives declining engagement and elevated departure risk. Sequential turnover is the most expensive form of turnover precisely because it compounds and remains organisationally invisible until it appears as a forecast miss (Xactly Corp., 2022/2025; Bridge Group, 2025).
👉 Key Insight: Turnover damage distributes across the entire sales ecosystem. Pipeline handovers cost selling time, territory gaps cost market share, and sequential turnover drives costs into a spiral that appears in no turnover statistic, only in quarterly revenue results.
Action Recommendations
Immediate Measures: This Week
Shift turnover cost accounting to a full-cost basis including ramp-up revenue loss: take direct costs as a starting point, apply a conservative multiplier of 3 to 5, differentiated by inside sales and field sales. Assess whether the organisation is prepared to adjust its retention investments accordingly.
Introduce pre-departure monitoring: what signals indicate withdrawal behaviour in which teams? Declining pipeline activity, falling win rates and missing forecast updates are documented early indicators in the sales context.
Map role complexity: for which field sales positions does the turnover cost factor exceed 200% of OTE? These roles require prioritised retention measures, irrespective of whether departures are currently visible.
Strategic Commitments: 6 to 24 Months
Introduce a comprehensive sales turnover cost model: capture revenue loss by ramp-up duration (inside vs. field), pipeline disruption costs and staffing costs systematically , as a business management variable at CSO and CFO level, not as an HR metric.
Build retention ROI calculations for key roles: for positions with turnover costs of 150 to 300% of OTE, every retention measure up to that amount is economically justifiable. Make this calculation explicit and incorporate it into compensation design and career pathway decisions.
Institutionalise pipeline and knowledge transfer protocols for all critical departures: structured handover processes prevent the majority of downstream revenue loss, particularly in field sales, where personal customer relationships are not automatically transferable.
Integrate team and pipeline metrics into turnover post-mortems: six months after a significant departure, systematically examine win rate, pipeline health and subsequent turnover for correlations with the departure event.
Final Thought
The paradox of sales turnover is straightforward: the most expensive costs arise invisibly, before the problem appears in a single forecast line. Sales organisations that measure their turnover costs in job postings and onboarding hours are optimising 20 to 35% of the problem and ignoring the rest. Retention is not an HR measure with a soft ROI. It is revenue and margin management, with a measurable, calculable and clearly positive return. The only thing still missing is the willingness to measure the uncomfortable part: ramp-up, pre-departure, pipeline ripple, separately for inside sales and field sales.
How does your sales organisation currently measure turnover costs, and have you ever explicitly calculated the revenue loss during ramp-up, differentiated by inside and field sales? Share your perspective or read our analysis: What Turnover Really Costs, the broader view on hidden costs across organisations.
References
Bridge Group (2025) Sales Development Technology Report 2025. Boston: The Bridge Group.
Everstage (2025) Sales Productivity Statistics: Trends & Data for 2026. Available at: everstage.com/sales-productivity/sales-productivity-statistics (Accessed: April 2026).
MarketBetter.ai (2026) The $150K Problem: What Losing One SDR Actually Costs. Available at: marketbetter.ai/blog/sdr-turnover-cost-analysis-2026/ (Accessed: April 2026).
Omnia (2025) The Sales Hiring Playbook: Sales Personalities at Work. Available at: omnia.co.nz (Accessed: April 2026).
SPOTIO (2026) The State of Field Sales 2026: Revenue Up Despite Quota Challenges. Available at: spotio.com/blog/state-of-field-sales-2026/ (Accessed: April 2026).
Xactly Corp. (2022, updated 2024/2025) Sales Turnover Statistics and Benchmarks. San Jose: Xactly Corporation.